Help
Toolbar-Graph
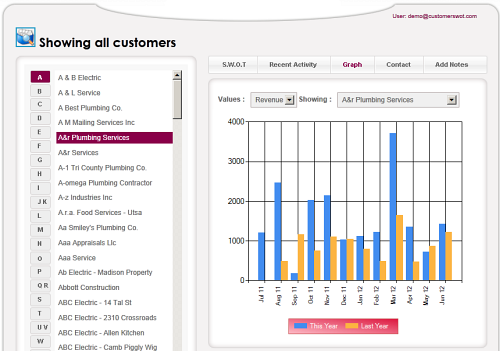
Allows the user to see a graphical representation of sales for a customer the past 2 12 months periods i.e. 24 months.
The numeric data can be one of:
- Revenue The total income from sales transactions.
- Margin The Profit Margin of the transaction (Revenue - Cost of Goods).
- Units The number of units sold in the transaction.
Clicking on the 'Export to PDF' button at the bottom of the screen will create a PDF report based on the data shown.